pacman::p_load(tidyverse, lubridate, plotly, patchwork, GGally, corrplot, readxl, psych)Singapore Tourism Recovery Visual Analytics CDA
The exploratory data analysis (EDA) highlighted several structural patterns in Singapore’s tourism data, including the pandemic shock to visitor arrivals, changes in source-market importance, and possible seasonal differences. Building on these observations, confirmatory data analysis (CDA) is used to statistically test whether these patterns are supported by the data.
Preparation
In this analysis, three tourism periods are defined:
- Pre-COVID: 2017 to 2019
- COVID Shock: 2020 to 2021
- Recovery: 2022 to 2025
Package Loading
tidyversefor data wrangling and static visualisationlubridatefor date handlingplotlyfor interactive chartspatchworkfor combining ggplot figuresGGallyandcorrplotfor exploratory relationship checksreadxlfor reading the Excel workbookpsychfor descriptive statistics
Data Loading
path <- "../data/raw/tourism_update.xlsx"

tour <- read_excel(
  path,
  sheet = "My Series",
  skip = 29,
  col_names = FALSE,
  .name_repair = "minimal"
)

names(tour) <- c(
  "Date",
  "Visitor Arrivals",
  "Tourism Receipts: YTD: YoY",
  "Tourist Expenditure Per Capita",
  "Visitor Arrivals: China",
  "Average Length of Stay",
  "Visitor Arrivals: Malaysia",
  "Visitor Arrivals: India",
  "Visitor Arrivals: Indonesia",
  "Visitor Arrivals: Australia",
  "Number of Hotels",
  "Visitor Days",
  "Hotel Room Occupancy Rate",
  "Visitor Arrivals: West Asia",
  "Visitor Arrivals: Taiwan",
  "Total Room Revenue",
  "Number of Hotels.1",
  "Average Length of Stay.1",
  "Visitor Arrivals: Hong Kong SAR (China)",
  "Hotel Revenue: per Available Room: Luxury",
  "Hotel Revenue: per Available Room: Mid-Tier",
  "Visitor Arrivals: ASEAN",
  "Visitor Arrivals: Italy",
  "Visitor Arrivals: Russian Federal (CIS)",
  "Visitor Arrivals: France",
  "Visitor Arrivals: Philippines",
  "Visitor Arrivals: Spain",
  "No of Hotel Room Stock",
  "Visitor Arrivals: Thailand",
  "Visitor Arrivals: Ireland",
  "Visitor Arrivals: United Arab Emirates",
  "Visitor Arrivals: United Kingdom",
  "Visitor Arrivals: Africa",
  "Visitor Arrivals: Bangladesh",
  "Visitor Arrivals: Iran",
  "Visitor Arrivals: New Zealand",
  "Visitor Arrivals: Israel",
  "Visitor Arrivals: North Asia",
  "Visitor Arrivals: 8-10 Days",
  "Visitor Arrivals: 11-14 Days",
  "Visitor Arrivals: 15 Days & Over",
  "Visitor Arrivals: Americas",
  "Visitor Arrivals: Germany",
  "Visitor Arrivals: Scandinavia: Sweden",
  "Visitor Arrivals: Switzerland",
  "Visitor Arrivals: USA",
  "Visitor Arrivals: Canada",
  "Visitor Arrivals: Mauritius",
  "Visitor Arrivals: Kuwait",
  "Visitor Arrivals: Egypt",
  "Visitor Arrivals: Brunei",
  "Visitor Arrivals: Finland",
  "Visitor Arrivals: Japan",
  "Visitor Arrivals: South Korea",
  "Visitor Arrivals: Myanmar",
  "Visitor Arrivals: Netherlands",
  "Visitor Arrivals: Scandinavia: Norway",
  "Visitor Arrivals: Saudi Arabia",
  "Visitor Arrivals: Sri Lanka",
  "Visitor Arrivals: Vietnam",
  "Visitor Arrivals: Pakistan",
  "Visitor Arrivals: Republic of South Africa"
)

tour <- tour %>%
  mutate(Date = as.Date(Date))

glimpse(tour)
Rows: 112
Columns: 62
$ Date <date> 2015-12-01, 2016-12-01,…
$ `Visitor Arrivals` <dbl> NA, 1506134, 1480479, 13…
$ `Tourism Receipts: YTD: YoY` <dbl> NA, 18.2358125, NA, NA, …
$ `Tourist Expenditure Per Capita` <dbl> 1429.751, 1569.697, NA, …
$ `Visitor Arrivals: China` <dbl> NA, 226020, 316805, 2689…
$ `Average Length of Stay` <dbl> NA, 3.214346, 3.517353, …
$ `Visitor Arrivals: Malaysia` <dbl> NA, 128897, 84504, 85058…
$ `Visitor Arrivals: India` <dbl> NA, 94323, 80062, 75905,…
$ `Visitor Arrivals: Indonesia` <dbl> NA, 329994, 254634, 2088…
$ `Visitor Arrivals: Australia` <dbl> NA, 100849, 115930, 7141…
$ `Number of Hotels` <dbl> NA, 237, 237, 237, 242, …
$ `Visitor Days` <dbl> NA, 56261555, NA, NA, NA…
$ `Hotel Room Occupancy Rate` <dbl> NA, 79.61207, 81.76737, …
$ `Visitor Arrivals: West Asia` <dbl> NA, 14895, 12581, 11749,…
$ `Visitor Arrivals: Taiwan` <dbl> NA, 21454, 36187, 38866,…
$ `Total Room Revenue` <dbl> NA, 298.0526, 299.8785, …
$ `Number of Hotels.1` <dbl> NA, 222, NA, NA, NA, NA,…
$ `Average Length of Stay.1` <dbl> NA, 3.429859, NA, NA, NA…
$ `Visitor Arrivals: Hong Kong SAR (China)` <dbl> NA, 36763, 34436, 33169,…
$ `Hotel Revenue: per Available Room: Luxury` <dbl> NA, 399.1838, 418.3350, …
$ `Hotel Revenue: per Available Room: Mid-Tier` <dbl> NA, 127.2986, 127.9719, …
$ `Visitor Arrivals: ASEAN` <dbl> NA, 637752, 478812, 4377…
$ `Visitor Arrivals: Italy` <dbl> NA, 5656, 6231, 5320, 54…
$ `Visitor Arrivals: Russian Federal (CIS)` <dbl> NA, 7739, 12262, 8949, 8…
$ `Visitor Arrivals: France` <dbl> NA, 11749, 12356, 16851,…
$ `Visitor Arrivals: Philippines` <dbl> NA, 68624, 46187, 51160,…
$ `Visitor Arrivals: Spain` <dbl> NA, 3592, 3529, 3625, 38…
$ `No of Hotel Room Stock` <dbl> NA, 57010.33, NA, NA, 56…
$ `Visitor Arrivals: Thailand` <dbl> NA, 43619, 36813, 38502,…
$ `Visitor Arrivals: Ireland` <dbl> NA, 1432, 1706, 1625, 17…
$ `Visitor Arrivals: United Arab Emirates` <dbl> NA, 7575, 4578, 4834, 83…
$ `Visitor Arrivals: United Kingdom` <dbl> NA, 39465, 46364, 54456,…
$ `Visitor Arrivals: Africa` <dbl> NA, 10784, 7040, 4403, 5…
$ `Visitor Arrivals: Bangladesh` <dbl> NA, 10960, 9712, 8788, 1…
$ `Visitor Arrivals: Iran` <dbl> NA, 1391, 1421, 1704, 80…
$ `Visitor Arrivals: New Zealand` <dbl> NA, 9994, 10778, 6928, 8…
$ `Visitor Arrivals: Israel` <dbl> NA, 1441, 1630, 1799, 16…
$ `Visitor Arrivals: North Asia` <dbl> NA, 101187, 113643, 1328…
$ `Visitor Arrivals: 8-10 Days` <dbl> NA, 30488, 40952, 31169,…
$ `Visitor Arrivals: 11-14 Days` <dbl> NA, 18884, 26157, 19386,…
$ `Visitor Arrivals: 15 Days & Over` <dbl> NA, 40291, 53134, 45682,…
$ `Visitor Arrivals: Americas` <dbl> NA, 67650, 72376, 68575,…
$ `Visitor Arrivals: Germany` <dbl> NA, 35176, 37068, 40022,…
$ `Visitor Arrivals: Scandinavia: Sweden` <dbl> NA, 4830, 6232, 5726, 46…
$ `Visitor Arrivals: Switzerland` <dbl> NA, 8513, 9079, 9867, 81…
$ `Visitor Arrivals: USA` <dbl> NA, 50542, 51562, 49370,…
$ `Visitor Arrivals: Canada` <dbl> NA, 10047, 11225, 11213,…
$ `Visitor Arrivals: Mauritius` <dbl> NA, 2394, 1142, 908, 864…
$ `Visitor Arrivals: Kuwait` <dbl> NA, 779, 1154, 508, 703,…
$ `Visitor Arrivals: Egypt` <dbl> NA, 338, 281, 312, 390, …
$ `Visitor Arrivals: Brunei` <dbl> NA, 10229, 5297, 4379, 7…
$ `Visitor Arrivals: Finland` <dbl> NA, 2750, 3929, 3834, 31…
$ `Visitor Arrivals: Japan` <dbl> NA, 62570, 53377, 72654,…
$ `Visitor Arrivals: South Korea` <dbl> NA, 38601, 60247, 60174,…
$ `Visitor Arrivals: Myanmar` <dbl> NA, 13691, 9902, 9783, 1…
$ `Visitor Arrivals: Netherlands` <dbl> NA, 6200, 7187, 6971, 67…
$ `Visitor Arrivals: Scandinavia: Norway` <dbl> NA, 2170, 2522, 2990, 26…
$ `Visitor Arrivals: Saudi Arabia` <dbl> NA, 809, 1065, 835, 1111…
$ `Visitor Arrivals: Sri Lanka` <dbl> NA, 12307, 5931, 6246, 7…
$ `Visitor Arrivals: Vietnam` <dbl> NA, 35494, 35367, 34586,…
$ `Visitor Arrivals: Pakistan` <dbl> NA, 1947, 1520, 1522, 20…
$ `Visitor Arrivals: Republic of South Africa` <dbl> NA, 5305, 3724, 1687, 27…Data Cleaning
data_clean <- tour %>%
  filter(year(Date) >= 2017 & year(Date) <= 2025) %>%
  mutate(
    Year = year(Date),
    Month = month(Date),
    Period = case_when(
      Year >= 2017 & Year <= 2019 ~ "Pre-COVID",
      Year >= 2020 & Year <= 2021 ~ "COVID Shock",
      Year >= 2022 & Year <= 2025 ~ "Recovery"
    ),
    Period = factor(Period, levels = c("Pre-COVID", "COVID Shock", "Recovery")),
    China_Share = (`Visitor Arrivals: China` / `Visitor Arrivals`) * 100
  )

data_clean %>% count(Year, Month)
# A tibble: 108 × 3
Year Month n
<dbl> <dbl> <int>
1 2017 1 1
2 2017 2 1
3 2017 3 1
4 2017 4 1
5 2017 5 1
6 2017 6 1
7 2017 7 1
8 2017 8 1
9 2017 9 1
10 2017 10 1
# ℹ 98 more rowssummary(data_clean$`Visitor Arrivals`) Min. 1st Qu. Median Mean 3rd Qu. Max.
750 512414 1313593 1032111 1488836 1802593 Descriptive Analysis
describe(
  data_clean %>%
    select(`Visitor Arrivals`, `Visitor Arrivals: China`, China_Share,
           `Hotel Room Occupancy Rate`, `Average Length of Stay`, `Visitor Days`)
)
vars n mean sd median
Visitor Arrivals 1 108 1032111.32 612394.34 1313593.00
Visitor Arrivals: China 2 108 170309.18 134822.73 213296.00
China_Share 3 108 17.46 12.12 16.97
Hotel Room Occupancy Rate 4 108 76.83 12.75 81.45
Average Length of Stay 5 108 9.37 12.09 3.56
Visitor Days 6 9 44984402.03 22235574.59 58801658.73
trimmed mad min max
Visitor Arrivals 1073270.80 375908.78 750.00 1802593.00
Visitor Arrivals: China 164503.36 169991.21 18.00 414488.00
China_Share 16.15 7.85 0.62 69.63
Hotel Room Occupancy Rate 78.43 6.84 40.16 93.90
Average Length of Stay 6.59 0.42 3.10 55.34
Visitor Days 44984402.03 7914223.52 7398670.56 64139729.36
range skew kurtosis se
Visitor Arrivals 1801843.00 -0.75 -1.06 58927.67
Visitor Arrivals: China 414470.00 0.01 -1.38 12973.32
China_Share 69.01 1.81 5.52 1.17
Hotel Room Occupancy Rate 53.74 -1.18 0.46 1.23
Average Length of Stay 52.24 2.15 3.93 1.16
Visitor Days 56741058.80 -0.73 -1.38 7411858.20CDA (Confirmatory Data Analysis)
CDA 1 - Statistical Impact of COVID-19 on Visitor Arrivals
Did the COVID-19 pandemic significantly affect visitor arrivals to Singapore?
Hypothesis
H₀ (Null Hypothesis)
There is no significant difference in visitor arrivals across the tourism periods.
H₁ (Alternative Hypothesis)
Visitor arrivals differ significantly across the tourism periods.
plot_ly(
  data = data_clean,
  x = ~Period,
  y = ~`Visitor Arrivals`,
  color = ~Period,
  type = "box",
  boxpoints = "outliers"
) %>%
  layout(
    title = "Visitor Arrivals Across Tourism Periods",
    xaxis = list(title = "Period"),
    yaxis = list(title = "Visitor Arrivals"),
    showlegend = FALSE
  )
anova_model <- aov(`Visitor Arrivals` ~ Period, data = data_clean)
summary(anova_model) Df Sum Sq Mean Sq F value Pr(>F)
Period 2 2.881e+13 1.441e+13 133.7 <2e-16 ***
Residuals 105 1.132e+13 1.078e+11
---
Signif. codes: 0 '***' 0.001 '**' 0.01 '*' 0.05 '.' 0.1 ' ' 1
Note
The boxplot compares the distribution of overall visitor arrivals across the three tourism periods. A marked downward shift is expected during the COVID Shock period relative to the Pre-COVID baseline, followed by a partial rebound in the Recovery period. If the ANOVA result is statistically significant, this supports the conclusion that visitor arrivals differed meaningfully across the three phases of tourism activity.
CDA 2 - Influence of China Share on Total Visitor Arrivals
Does China’s share of Singapore’s inbound tourism market significantly influence total visitor arrivals?
Hypothesis
H₀ (Null Hypothesis)
China’s visitor share has no significant relationship with total visitor arrivals.
H₁ (Alternative Hypothesis)
China’s visitor share significantly influences total visitor arrivals.
ggplot(data_clean, aes(x = China_Share, y = `Visitor Arrivals`)) +
  geom_point(alpha = 0.6) +
  geom_smooth(method = "lm", color = "red") +
  labs(
    title = "Relationship Between China Market Share and Total Visitor Arrivals",
    x = "China Share of Total Visitor Arrivals (%)",
    y = "Visitor Arrivals"
  ) +
  theme_minimal()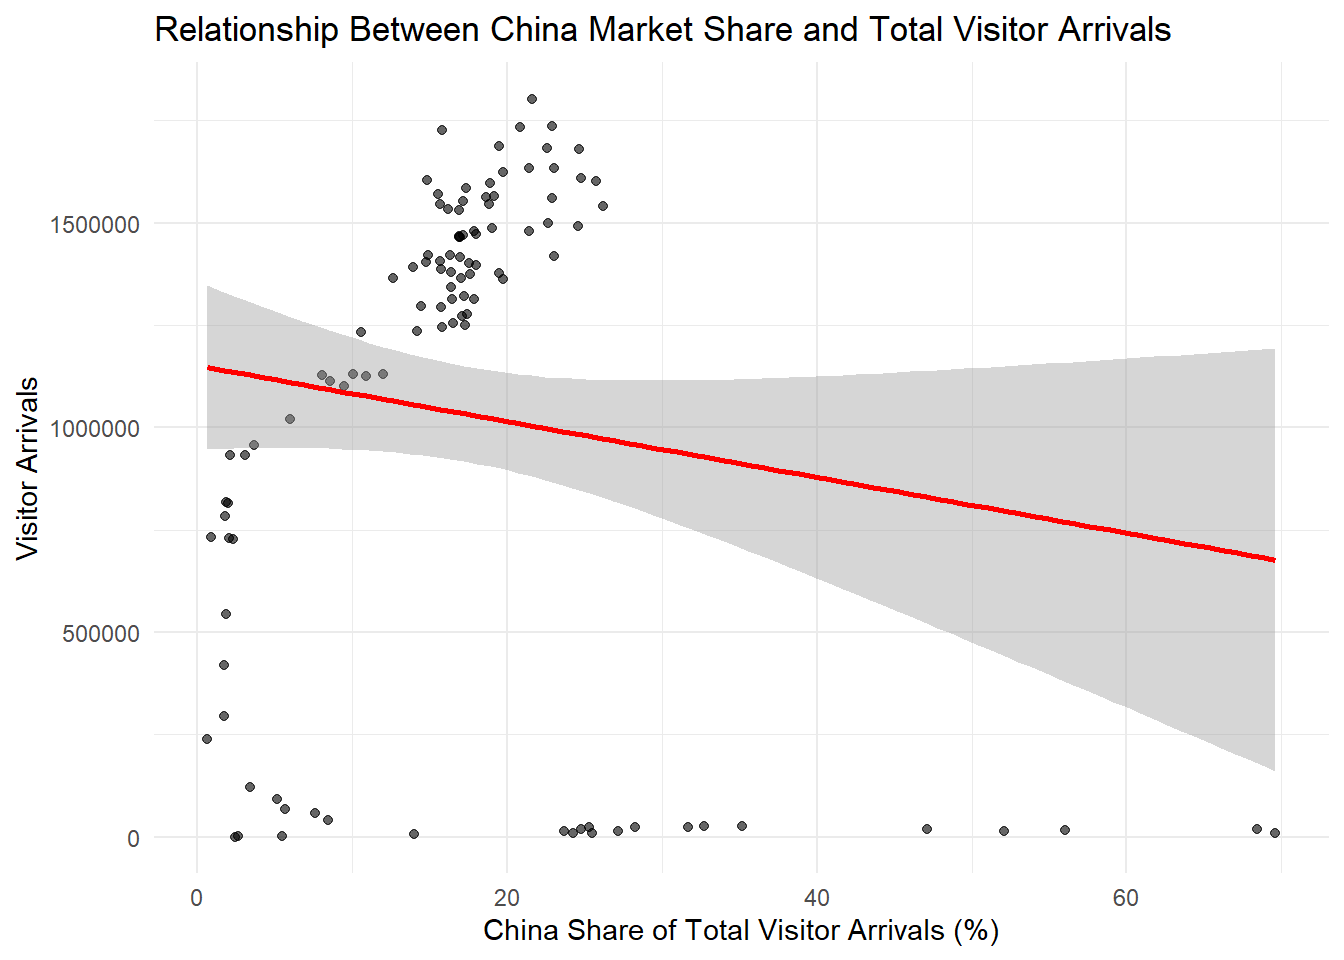
model_cda2 <- lm(`Visitor Arrivals` ~ China_Share, data = data_clean)
summary(model_cda2)
Call:
lm(formula = `Visitor Arrivals` ~ China_Share, data = data_clean)

Residuals:
     Min       1Q   Median       3Q      Max
-1133928  -612539   279205   479648   798720

Coefficients:
            Estimate Std. Error t value Pr(>|t|)
(Intercept)  1151022     103205   11.15   <2e-16 ***
China_Share    -6810       4863   -1.40    0.164
---
Signif. codes:  0 '***' 0.001 '**' 0.01 '*' 0.05 '.' 0.1 ' ' 1

Residual standard error: 609700 on 106 degrees of freedom
Multiple R-squared:  0.01817,   Adjusted R-squared:  0.008903
F-statistic: 1.961 on 1 and 106 DF,  p-value: 0.1643
Tip
Interpret the regression using both the p-value and the \(R^2\) value. A statistically insignificant coefficient would suggest that changes in China’s share alone do not explain much of the variation in Singapore’s total visitor arrivals.
CDA 3 - Seasonal Variation in Visitor Arrivals
Do visitor arrivals vary significantly across months?
Hypothesis
H₀ (Null Hypothesis)
Visitor arrivals do not differ significantly across months.
H₁ (Alternative Hypothesis)
Visitor arrivals vary significantly across months, indicating seasonal tourism patterns.
data_no_covid <- data_clean %>%
  filter(!Year %in% c(2020, 2021)) %>%
  mutate(Month_Label = month(Date, label = TRUE, abbr = TRUE))
p <- ggplot(
data_no_covid,
aes(
x = Month_Label,
y = `Visitor Arrivals`,
text = paste(
"Month:", Month_Label,
"<br>Visitor Arrivals:", format(`Visitor Arrivals`, big.mark = ",")
)
)
) +
geom_boxplot(fill = "skyblue") +
labs(
title = "Seasonal Variation in Visitor Arrivals",
x = "Month",
y = "Visitor Arrivals"
) +
theme_minimal()
ggplotly(p, tooltip = "text")anova_month <- aov(`Visitor Arrivals` ~ Month_Label, data = data_no_covid)
summary(anova_month) Df Sum Sq Mean Sq F value Pr(>F)
Month_Label 11 8.784e+11 7.986e+10 0.525 0.881
Residuals 72 1.096e+13 1.522e+11
Tip
The monthly distributions are based on observations from 2017–2025, with the COVID shock years (2020–2021) excluded to reduce distortion in seasonal patterns.
A statistically significant ANOVA result would indicate that average visitor arrivals differ across months, suggesting seasonality in tourism demand. If the p-value is not significant, this would imply limited evidence of strong seasonal differences in the dataset after excluding the COVID shock years.